
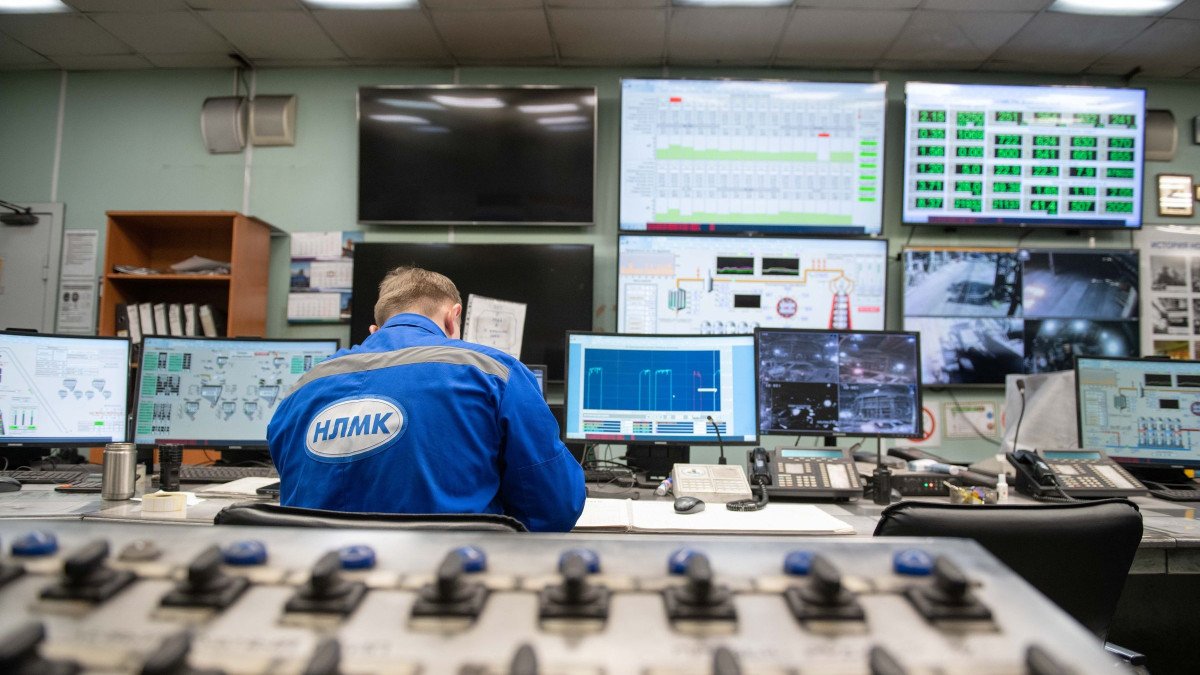
Industrial operations already have plenty of screens. A typical control room shows trends, alarms, mimics and status panels; maintenance teams have their own dashboards; the reliability engineer has a spreadsheet; and the vendor of almost every new piece of equipment offers yet another portal. Each one was added to make information visible. Together they have created a different problem. There is more information on display than anyone has time to interpret.
The next wave of industrial AI should not add to the pile. Its job is to reduce the work between a signal and a good decision.
Visibility is not the bottleneck
Most plants are not short of data. Historians store years of process values. Building management systems log thousands of points. Vibration programs collect routes of measurements every month. What plants are short of is time and expertise to turn that data into action.
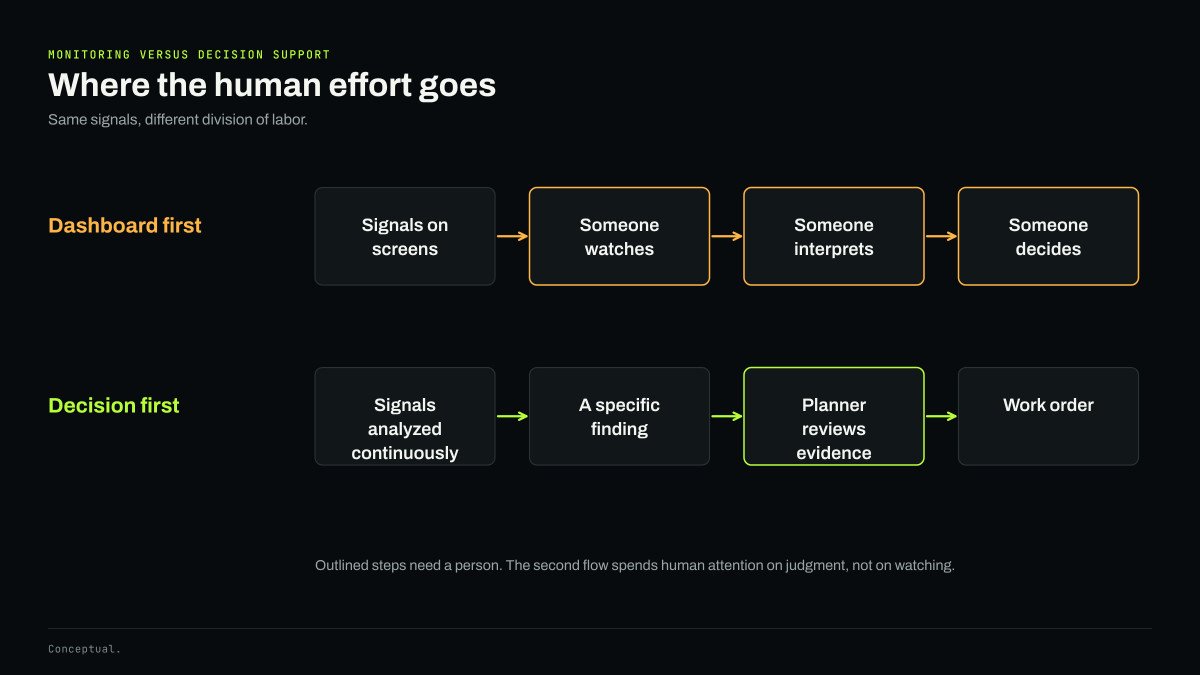
A dashboard assumes that someone is watching, that the person watching can tell what matters, and that they know what to do about it. In practice, the people best able to interpret machine data are usually busy fixing machines. The dashboard waits for attention that rarely comes, and the developing fault it could have shown sits in plain view on a screen nobody opened.
How more data made the problem worse
It is worth asking how plants arrived here. Each generation of industrial technology made it cheaper to collect and display data. Control systems replaced panels of gauges with screens that could show any point in the plant. Historians made it possible to keep every value for years. Wireless sensors and cloud platforms lowered the cost of adding new measurements to almost nothing.
The cost of interpreting data did not fall in the same way. It still takes an experienced person to look at a trend and judge whether it matters. So the gap between what is collected and what is understood has widened with every upgrade. A plant can now have many times more measurements than it did a generation ago and roughly the same number of people to look at them.
So the measure of a new system should not be how much it adds to the screen, but how much interpretation it takes off people's hands. Automating the routine reading of signals is where the real gain lies.
Alarm floods are the warning
The process industries learned this lesson the hard way with alarms. As control systems made it cheap to add alarms, plants added them by the thousand, until operators faced more alerts than they could possibly handle. Incident investigations have repeatedly pointed to operators swamped by alarms during the critical minutes.
The response was a discipline of alarm management. The ISA-18.2 standard and the earlier EEMUA 191 guide treat every alarm as a demand on an operator's attention, and require each one to be justified. Performance targets associated with ISA-18.2 put the manageable load at roughly 150 to 300 annunciated alarms per operating position per day, or one to two every ten minutes. They describe an alarm flood as starting when more than ten alarms arrive in ten minutes, and suggest the system should be in that state less than 1 percent of the time.
Those numbers are worth keeping in mind whenever someone proposes a new monitoring system. If it adds alerts without removing work, it is moving in the wrong direction.
What a decision needs
A maintenance planner deciding whether to act on a machine needs a small number of things. Which asset, and which part of it. What changed, and how confident the system is. Whether another signal backs it up. How much it matters given the asset's role. And what to check first.

A good finding answers those questions in a few lines. It does not ask the planner to open five trend charts and work out the story. It does the interpretation, shows its evidence, and leaves the decision with the person accountable for it.
Three design principles
Fewer, better alerts. A system that learns each machine's normal behavior, and corroborates a change across more than one kind of signal, can stay quiet about ordinary variation and speak up when something has actually changed. The goal is that every alert deserves a response.
Evidence attached. Trust comes from transparency. A finding should carry the measurements behind it, so an experienced technician can check the reasoning in a minute. Black-box scores without evidence get ignored, and then they get switched off.
Delivered where work happens. Findings belong in the systems people already use to plan work, such as the maintenance management system or the shift handover, not in another portal that needs its own login. The best interface for a busy team is often no new interface at all.
Closing the loop
A finding is only half of the cycle. The other half is what happens after a technician acts on it. Did the inspection confirm a worn bearing, or was the machine fine? Was the cause lubrication, misalignment or something else? That information usually ends up as a few words in a work order, if it is recorded at all, and it rarely flows back to the system that raised the alert.
Closing that loop is what lets a decision-support system improve. Confirmed findings teach it which patterns matter on which machines. False alarms teach it where to be more cautious. Over time, a site's own maintenance history becomes the most valuable training data it has, because it describes its own equipment in its own conditions. A dashboard cannot learn from what happened after someone looked at it. A system built around findings and outcomes can.
The practical requirement is modest: a simple way for the person who did the work to record what they found, in the tool they already use, with the finding attached. The value of that small habit compounds.
Dashboards still have a place
None of this means getting rid of trends and displays. Engineers investigating a problem need to see the data, and good visualization helps them reason about it. The change is in the default. The dashboard becomes the place you go to examine the evidence behind a finding, not the place you have to stare at in case a finding appears.
Questions worth asking
For anyone evaluating an industrial AI product, a few questions cut through most of the marketing.
- How many alerts will my team receive per week, per hundred assets? A vendor that cannot estimate this has not thought about attention as a cost.
- What evidence comes with each alert? Ask to see a real finding, not a demo screen.
- How does it handle changes in speed, load or season? Operating context is where most false alarms come from.
- Where do findings appear? If the answer is only a new portal, adoption will depend on people remembering to check it.
- How does it learn from what technicians find? Without feedback, accuracy stays fixed at whatever it was on day one.
The same event, two ways
The difference between a dashboard and a decision is easiest to see side by side. Here is one developing fault, a bearing problem on a cooling water pump, presented two ways.
| Alarm style | Decision style |
|---|---|
| P-104 VIB HIGH, 7.2 mm/s | Pump P-104, drive end bearing: outer race defect pattern, rising steadily for 11 days |
| Status: active, unacknowledged | Likely weeks of safe running at the current rate of change, not days |
| Trend chart available on request | Evidence attached: envelope spectrum and the trend since the baseline was learned |
| No recommended action | Plan bearing replacement at the next scheduled stop; standby pump P-105 is healthy |
The alarm on the left is accurate. It is also nearly useless to a busy team. Someone has to open the trend, judge whether 7.2 is high for this pump, guess at the cause, check the standby unit and decide how urgent it is. Multiply that by dozens of alarms a day and the work never gets done.
The finding on the right does that work up front. It names the component and the fault, states how confident and how urgent it is, shows its evidence and connects to a specific action in context. The underlying data is the same. What changed is how much of the reasoning the system did before asking a person for attention.
Measuring the right thing
The test for industrial AI is not how much data it collects or how attractive its displays are. It is whether decisions get better: fewer unplanned failures, less time spent investigating false alarms, earlier and calmer planning of the work that is needed. Those outcomes can be measured, they can be compared before and after a system is introduced, and they are the ones operations leaders actually care about.
That is the standard we hold our own industrial intelligence platform to while it is in development. The broader idea behind it is explained in what we mean by Machine Health Intelligence.


