
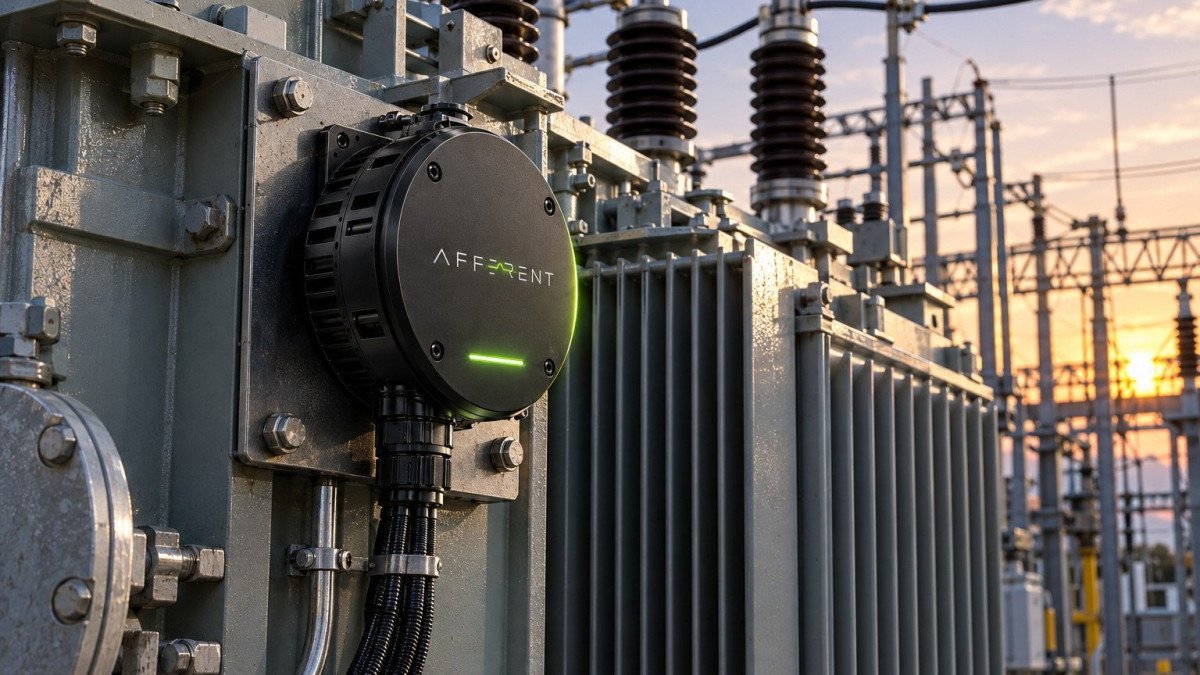
Physiologists have a word for the sense most people forget they have. Proprioception is the body's awareness of its own position and condition: where your hand is with your eyes closed, how hard a muscle is working, whether a joint is under strain. Without it, a person can see and hear perfectly and still be unable to stand steadily.
The electricity grid has superb senses for some things and almost none for others. It measures voltage, current, frequency and power flow with great precision, many times a second, across its high voltage backbone. It knows far less about the physical condition of the equipment carrying those flows: whether a transformer's insulation is aging faster than planned, whether a cooling fan bearing is wearing, whether a connection is running hot. This article looks at where that gap sits, why it matters more each year, and what it would mean for the grid to feel itself.
Electrical senses, physical blind spots
Grid operators watch electrical state closely because they have to. Supply and demand must balance continuously, and protection systems must clear faults in fractions of a second. Supervisory control and data acquisition systems, energy management systems and protective relays give operators a detailed, real time picture of how power is flowing through the transmission network and the larger substations.
Equipment condition is a different kind of information. It changes over weeks and years rather than milliseconds, and it is measured, where it is measured at all, by different means: oil samples sent to laboratories, infrared surveys, periodic electrical tests, inspection rounds. The largest and most important transformers often have dedicated online monitors. Most of the rest of the network's equipment does not.

The pattern in the diagram is a generalization, and practice varies widely between utilities. But the shape is common. Visibility of equipment condition is deepest where assets are largest and fewest, and thinnest where they are smallest and most numerous. It is the pattern we described across industry in the physical world is still under-instrumented, and the grid is one of its clearest examples.
Why the gap matters more now
For most of the last century, the grid carried power one way, from large generators to consumers, along paths that were planned years in advance. That pattern is changing in several ways at once.
Demand is rising and changing shape. Electric vehicles, heat pumps, electrolysis and data centers are adding load, and much of it arrives in places and at times the original network design did not anticipate. The IEA's Energy and AI report projects that electricity consumption by data centers worldwide will more than double by 2030, to around 945 terawatt-hours, slightly more than Japan's total electricity consumption today.
Generation is moving to the edges. Rooftop solar, community storage and distributed resources inject power into parts of the network that were built only to deliver it. Distribution equipment now sees reverse flows, faster swings and different thermal cycles.
The network has to grow. In Electricity Grids and Secure Energy Transitions, published in October 2023, the IEA estimates that reaching national energy and climate goals means adding or refurbishing more than 80 million kilometers of grids by 2040, equivalent to the entire existing global grid. It also found at least 3,000 gigawatts of renewable projects, 1,500 of them at advanced stages, waiting in grid connection queues.
The installed base is old and slow to replace. While the network grows, existing equipment has to carry more for longer. That last point deserves a closer look, because it is where the case for sensing condition is strongest.
The transformer problem
Large power transformers are among the most important and least replaceable pieces of equipment on the grid. The U.S. Department of Energy notes that more than 90 percent of consumed power passes through high voltage transformers at some point, and its study of large power transformers sets out why losing one is so serious.
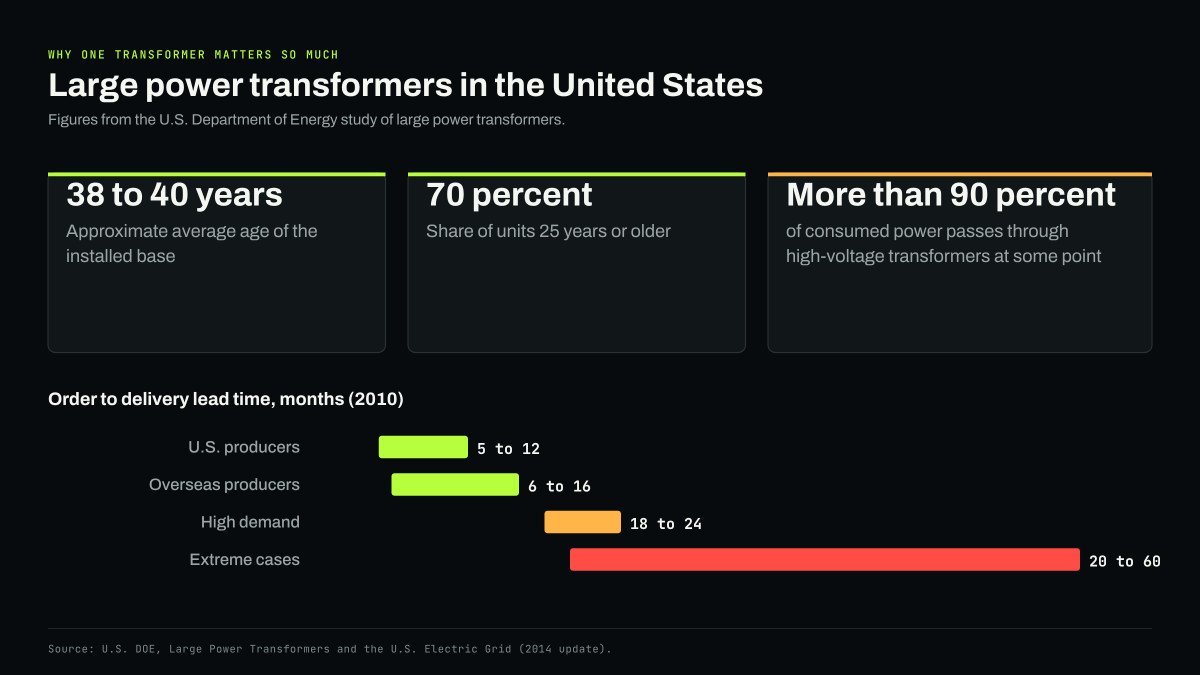
According to that study, the average age of installed large power transformers in the United States was roughly 38 to 40 years, with about 70 percent of units 25 years or older. They are custom designed, weigh between 100 and 400 tons, and need special transport. In 2010, the lead time from order to delivery ranged from 5 to 12 months for domestic producers and 6 to 16 months for producers abroad, and could stretch to 18 to 24 months when demand was high. In extreme cases, where key inputs were hard to obtain or substantial new engineering was needed, the study noted that lead times could extend beyond 20 months and up to five years.
Put those figures together and the logic is plain. A transformer that fails unexpectedly cannot be replaced quickly. The network has to work around it, often with reduced margin, for months. Knowing in advance which units are aging fastest, which cooling systems are struggling and which tap changers are wearing is worth a great deal, because it turns an emergency replacement into a planned one, or a planned replacement into a deferred one.
What equipment reveals
Power equipment degrades in ways that produce physical evidence, and much of that evidence can be sensed from outside the asset.
| Equipment | Common degradation | Physical evidence |
|---|---|---|
| Transformer core and windings | Loosened clamping, insulation aging | Changes in hum and vibration under load; temperature rise |
| Transformer cooling | Fan and pump bearing wear, fouled radiators | Vibration and sound of fans and pumps; higher operating temperature |
| Tap changers | Contact and mechanism wear | Changing acoustic and vibration signature during operation |
| Bushings and connections | Insulation deterioration, loose joints | Localized heating; partial discharge emissions |
| Inverters and power electronics | Component aging, cooling faults | Thermal and electrical changes; fan wear |
None of this is new to utility engineers. Oil sampling, infrared surveys and dedicated monitors are established practice for major assets. The difference is coverage and frequency. Sampled once a year, a transformer is observed once a year. Observed continuously, it can show how its temperature responds to each hot afternoon, how its cooling fans behave as they age, and how its tap changer sounds on every operation.
A worked comparison
Consider an illustrative distribution utility with 400 substation transformers. Assume each is visited for inspection four times a year and has oil sampled once a year, and that a developing problem in its cooling system takes about three months to go from first detectable change to an overheating event. The figures are assumptions for teaching.
With quarterly visits, a problem that develops over three months has a fair chance of being caught, but only if the inspection happens to occur during the window and the inspector happens to notice the right thing. A fan with a worn bearing may sound normal on the day of the visit and fail two weeks later on a hot day. With continuous observation, the same change appears as a trend in the fan's vibration and the unit's thermal behavior from the first weeks, and it can be ranked against every other finding across the 400 sites.
The same reasoning applies to oil sampling. An annual sample shows the gases dissolved in a transformer's oil on one day. It cannot show whether a change began last week or ten months ago, or whether it tracks load, temperature or switching. Continuous observation of the unit's external behavior does not replace the laboratory, but it can tell an engineer when an extra sample would be worth taking.
Continuous sensing does not replace inspection crews either. What it changes is that crews arrive at the sites that need them, with an idea of what to look at, instead of distributing their time evenly across sites that mostly do not.
What feeling itself would mean
A grid that can feel itself would know, for each important asset, how hard it is working, how fast it is aging and what is changing in its condition. It would hold that knowledge alongside the electrical picture operators already have, so that a planner deciding whether to add load to a feeder could see the condition of the transformers on it as easily as their rated capacity.
Three design requirements follow from the nature of utility equipment.
Work at the edge. Substations and remote sites often have limited or intermittent connectivity. Devices that analyze signals locally and send findings, as we explained in our piece on edge AI in industrial infrastructure, need far less from the network and keep working when the link drops.
Observe without controlling. Sensing equipment should sit outside the control and protection systems on which grid safety depends. A monitoring device that cannot operate anything cannot become a path to operating anything.
Treat security as basic. Energy infrastructure is a recognized target. Device identity, encrypted communication and a design that does not require inbound network access are starting points, not options.
The sense the grid is missing
Utilities have spent decades building one of the most sophisticated sensing and control systems in the world for the electrical state of their networks. The next step is a sense of physical condition across the equipment that carries that electricity, especially the vast population of assets below the largest substations. That is the work of energy and grid intelligence: giving the grid the equivalent of proprioception, so it knows the strain on its own joints before one of them gives way.


