
The last decade of artificial intelligence was built on data that already existed. Text, images, code and video had been piling up on the internet for twenty years, and the companies that learned to train on it at scale moved fastest. When the raw material is public, advantage goes to whoever has the most compute, the best methods and the fastest teams.
Machines in the physical world do not post their vibration spectra online. The data that describes how pumps, motors, transformers and compressors behave, and especially how they fail, mostly does not exist yet. Where it does exist, it sits in private systems, unlabeled and scattered. That difference is why we think the next durable data advantage in AI will be physical. It is also why that advantage is harder to build than it sounds.
Why data mattered so much in the first place
Two ideas explain the recent history. In his 2019 essay The Bitter Lesson, Richard Sutton argued that over seventy years of research, general methods that scale with computation have repeatedly beaten approaches built on hand-coded human knowledge. A year later, researchers at OpenAI published Scaling Laws for Neural Language Models, showing that model performance improved as a smooth power law as model size, dataset size and compute increased together.
Put those together and data becomes a strategic input. If performance keeps improving with more data, then access to data that others cannot get is a lasting edge. In language and vision, though, much of the data was available to everyone. The ImageNet database, which shaped a decade of computer vision research, indexes 14,197,122 images. Those images were gathered from the open web and labeled through crowdsourcing. Competitors could build similar collections, and they did.
What exists for machines
Public machine datasets exist, and they have been valuable to research. NASA's Prognostics Center of Excellence data repository includes the widely used turbofan engine degradation simulation data, known as C-MAPSS, which models engines running from healthy operation to failure. The MIMII dataset, released by researchers at Hitachi, contains recordings of valves, pumps, fans and slide rails under normal and anomalous conditions, such as contamination, leakage, rotating unbalance and rail damage.
These datasets share limits that are hard to avoid. Some are simulated. Some use faults introduced deliberately in a laboratory or test rig. Most cover a handful of machine types under a narrow range of conditions. None captures the variety of a real fleet: different manufacturers, installations, duty cycles, ambient conditions, maintenance practices and decades of age. A model that performs well on a benchmark can struggle on a pump in a hot, wet lift station with a bent baseplate.
Why physical data is scarce
Failures are rare. Good operators work hard to prevent failures, and most machines run for years between serious faults. This is good for business and bad for training data. The events a model most needs to learn are the ones that happen least often.
The data stays inside the fence. Industrial data lives in plant historians, maintenance systems and spreadsheets owned by thousands of separate organizations. Little of it is shared, and much of it is never digitized at all.
Signals without labels say little. A vibration record becomes useful for learning when someone can say what was happening: the bearing was found pitted, the alignment was off by half a millimeter, or the alert was a false alarm caused by a nearby compressor. Those labels come from maintenance records and technician notes, and they are often missing, vague or never linked to the sensor data. We discussed why confirmed outcomes matter so much in our article on false positives.
Context is half the meaning. The same vibration level can be normal for one machine and alarming for another. Asset type, speed, load, mounting, environment and history all change how a signal should be read. Collecting that context takes deliberate effort at installation and over time.

A rough count of labeled failures
The scarcity is easier to see with arithmetic. Suppose, for illustration, a fleet of 10,000 monitored rotating machines. Assume that a particular failure mode, say outer race bearing damage, appears in 2% of them each year, and that half of those cases end up with a confirmed diagnosis linked to the sensor record.
| Step | Illustrative figure |
|---|---|
| Machines monitored | 10,000 |
| Cases of the failure mode per year (2%) | 200 |
| Cases with a confirmed, linked label (50%) | 100 |
| Labeled cases after five years | About 500 |
Five years of a large deployment yields hundreds of well-labeled examples of one failure mode, set against millions of hours of normal operation. Compare that with millions of labeled images. The numbers explain both why physical data is valuable and why it cannot be gathered quickly. Time is part of the cost. There is no way to buy five years of confirmed bearing failures from machines in service except by having devices on those machines for five years and doing the work of recording what happened.
Why the sensor matters to the dataset
In language and vision, the data was created by others and collected afterward. In machine health, the instrument that captures the data shapes what the data can say. Sampling rate, frequency response, mounting, synchronization between signals and the processing applied on the device all determine whether a recording contains the early signature of a fault or only its late, obvious stage.
Consistency matters as much as quality. A model trained on data from thousands of identical devices, mounted in similar ways and processed by the same software, can compare one machine with another meaningfully. One trained on data from a mix of sensors with different bandwidths, orientations and sampling schemes spends much of its capacity learning the differences between instruments rather than the differences between machines.
| Data source | Typical strength | Typical weakness |
|---|---|---|
| Existing plant historians | Long history, operating context | Low sample rates; few condition signals |
| Route-based portable readings | High-quality spectra | Monthly snapshots; gaps between visits |
| Mixed third-party sensors | Broad coverage | Inconsistent instruments and formats |
| A consistent, purpose-built device fleet | Comparable, continuous, multi-signal data | Takes years and many installations to build |
This is one reason the physical data advantage tends to belong to companies that control the measurement as well as the model.
The physical data flywheel
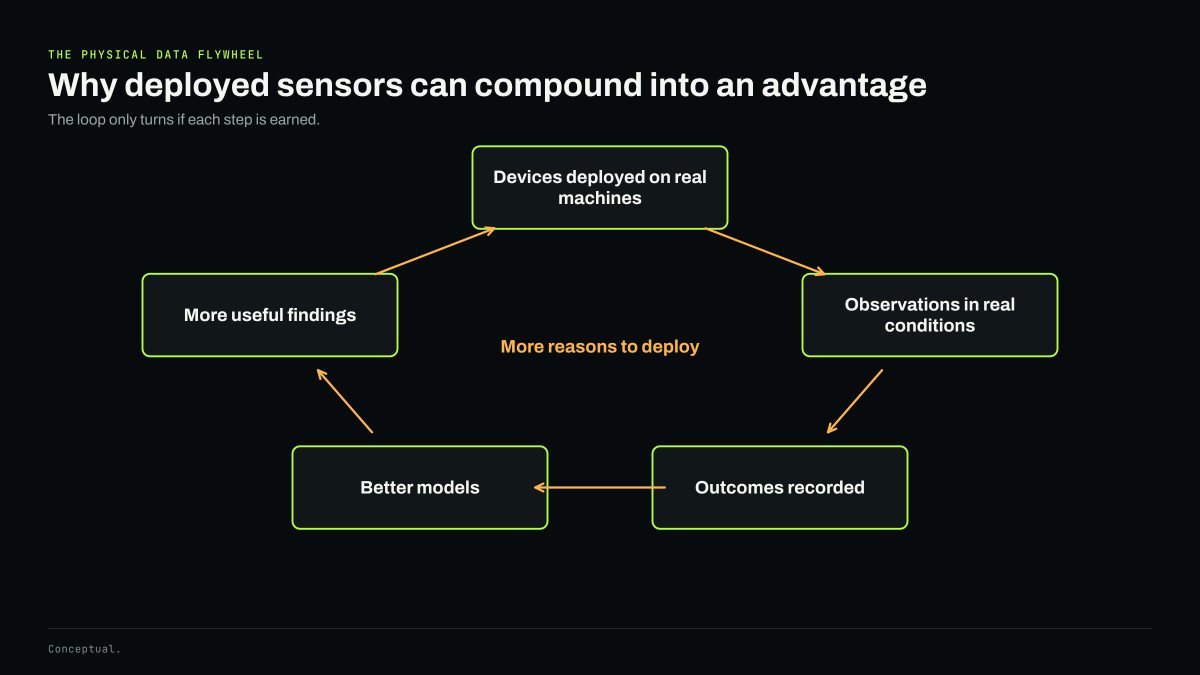
The idea of a data flywheel is familiar from software. Applied to physical infrastructure, it runs like this: devices on real machines produce observations in real conditions; maintenance teams confirm what they find; those outcomes improve the models; better models produce more useful findings; and useful findings give operators a reason to deploy more devices.
Some companies already describe their businesses in these terms. In its fiscal 2026 results announcement, Samsara said more than 25 trillion data points flow through its platform each year and described a data network effect, in which its models become more insightful as it adds customers and assets. That is the company's own characterization, but it shows how seriously the idea is taken in connected operations.
Where the argument is weaker
A data moat is easy to claim and hard to prove. Several cautions apply.
- Returns diminish. The thousandth example of a common fault teaches a model less than the tenth. Volume alone is not an advantage. Coverage of rare conditions and machine types is.
- Customers own their data. The right to use operational data for model training is set by contracts, and buyers are increasingly careful about it. A dataset a company cannot legally learn from is not a moat.
- Hardware changes break history. Data from one sensor design does not always transfer to the next. A company that changes its hardware without care can strand years of history.
- Methods can substitute for data. Physics-based models, transfer learning and simulation can reduce how much field data a model needs. Sutton's lesson cuts both ways: better general methods may make a given dataset less decisive.
None of these cautions makes physical data unimportant. They mean the advantage belongs to whoever builds the scarce layers well, with rights to use them, over many years, rather than to whoever collects the most raw signal.
What it means in practice
For operators evaluating monitoring systems, a few questions follow from this argument. Who owns the data, and what can the vendor do with it? How are confirmed outcomes captured and fed back? Does the system improve over time for your fleet, and can the vendor show how?
For companies building in this field, the lesson is to design for labels from the start. Make it easy for technicians to record what they found. Capture asset context at installation. Keep data formats stable across hardware generations. Treat every confirmed fault and every false alarm as a piece of the dataset. Those are the habits that turn sensor data into distributed industrial asset intelligence and, over time, into machine health intelligence models that understand what a signal means. As we argued in why failure has a signature, the physics is there to be learned. The scarce part is the record of what actually happened.


