

"Anomaly detected" is one of the most common messages a machine monitoring system can send, and one of the least useful on its own. It tells a maintenance planner that something is different. It does not say what, where, how serious, or how long there is to act. Those are separate questions, and treating them as one is behind many of the disappointments people report with predictive maintenance.
This article separates the words that tend to get blurred together, walks through the four distinct jobs a machine health system has to do, and follows a single synthetic example from the first sign of change to an estimate of remaining life.
Three words that are not the same
An anomaly is a statistical statement. A measurement, or a pattern of measurements, falls outside what the system has learned to expect. Nothing in that definition says the machine is damaged. It only says the data are unusual.
A fault is a physical statement. Some component is in an abnormal condition: a bearing race has a spall, a shaft is misaligned, an impeller is eroded, a winding's insulation is breaking down. A fault can exist for a long time while the machine continues to do its job.
A failure is a functional statement. The machine can no longer do what it is needed to do, at the standard it is needed to do it. The reliability engineers Stanley Nowlan and Howard Heap made this distinction central to their 1978 report on reliability-centered maintenance, separating a functional failure from a potential failure, the identifiable condition that shows a functional failure is on its way. Most of the value in condition monitoring lives in the gap between those two.
The three words describe different things, and the relationships between them are loose. Many anomalies have nothing to do with faults. Many faults never produce an anomaly that anyone is measuring. And a fault becomes a failure on its own schedule, which depends on load, environment and luck as much as on the defect itself.
Why most anomalies are not faults
Anyone who has run an anomaly detector on real equipment learns quickly that the machine is rarely the only thing that changes. The table below lists the usual suspects.
| Cause of the anomaly | Example | What it means for maintenance |
|---|---|---|
| Operating change | A pump moves to a new duty point after a valve change upstream | Nothing, once the new state is learned |
| Environment | Ambient temperature rises 15 degrees on a summer afternoon | Nothing, if the model accounts for ambient |
| Measurement problem | A sensor mount loosens, or a cable picks up drive noise | Fix the sensor, not the machine |
| Maintenance itself | A bearing is regreased and its acoustic signature changes for a day | Expected; often a sign of good work |
| Process upset | Entrained air or a blocked strainer changes the flow | A real problem, but not with the machine |
| Developing fault | Outer race damage begins to show at the bearing's defect frequency | The case the system exists to find |
Only the last row is a machine fault. A detector that flags all six with equal urgency will be right about the data every time and wrong about what matters most of the time. That is the root of the alarm fatigue that sinks so many monitoring projects.
Four jobs, in order
The international standards for condition monitoring have treated these as separate functions for two decades. ISO 13374-1 describes a processing chain that runs from data acquisition and manipulation through state detection, health assessment and prognostic assessment to advisory generation. ISO 13381-1 deals specifically with prognostics, the estimation of how a condition will evolve and how much useful life remains. Stripped to the questions an operator asks, the chain has four stages.

Detection asks whether the machine is behaving differently from its own normal. The best detectors learn each machine individually across its operating states, because two identical pumps on different duties look nothing alike. Detection can work without labeled examples of faults, which is fortunate, since most sites have very few. Research benchmarks reflect this. The DCASE 2020 machine condition task asked teams to detect anomalous machine sounds using training data that contained only normal operation.
Diagnosis asks what is changing and where. This is where physics earns its keep. A rolling element bearing produces vibration at frequencies determined by its geometry and the shaft speed; misalignment shows up at multiples of running speed; cavitation produces broadband acoustic energy. A diagnosis ties the anomaly to a mechanism and a component. We described these signatures in why failure has a signature.
Prediction asks how the condition is likely to evolve. Some faults grow steadily, some plateau, and some accelerate once damage reaches a threshold. Prediction needs the diagnosis, because different mechanisms progress differently, and it needs context about load, speed and duty.
Remaining useful life asks how long until the machine can no longer do its job. It is the most valuable output and the hardest to produce well, because it is a forecast about a physical process with real uncertainty.
Following one machine
The chart below shows a synthetic health indicator for a pump bearing over 120 days. The numbers are invented for illustration, but the shape is typical of how a bearing defect develops.
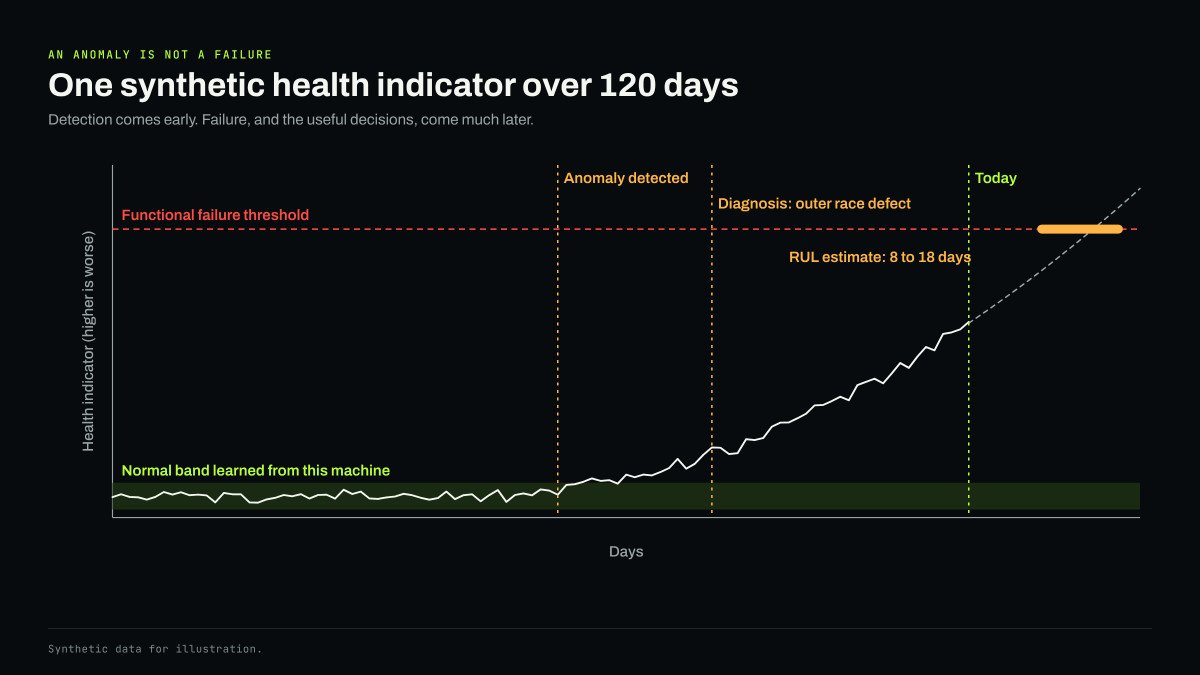
For the first 40 days the indicator sits inside the band the system has learned for this particular machine. Around day 40 the defect begins, but its effect is smaller than normal variation. By day 52 the indicator has left the band often enough for the detector to raise an anomaly with reasonable confidence.
At day 52, the right response is curiosity, not a work order. The system knows the data have changed. It does not yet know why. Over the next few weeks the evidence accumulates: energy concentrates at the bearing's outer race defect frequency, the acoustic signature shifts, and the temperature at the bearing housing creeps up relative to the motor. By day 70 a diagnosis of outer race damage is well supported.
Once the diagnosis is firm, the right response is planning. The fault is real and its location is known. The question is when to act, and the answer depends on how fast it is progressing. Thirty days later there are enough points on the curve to fit a progression model, and the system estimates that the indicator will cross the functional failure threshold in 8 to 18 days.
That range matters as much as its midpoint. A remaining life estimate of "13 days" invites false precision. A range of 8 to 18 days tells the planner to schedule the job within a week and to treat any acceleration as a reason to move faster.
What each stage lets you do
| Stage reached | Decision it supports | Typical action |
|---|---|---|
| Detection | Should someone look? | Review data, check for operating or sensor causes |
| Diagnosis | What should they look at? | Targeted inspection, order the right parts |
| Prediction | How urgent is it? | Rank against other work, adjust load if possible |
| Remaining life | When must it be done? | Schedule into a planned window |
Each stage adds a different kind of value. Detection alone can be very useful if a skilled analyst reviews every flag, and many successful programs started that way. But detection alone does not scale, because the analyst becomes the diagnosis, prediction and planning stages all at once, for every machine.
Why the remaining life estimate is so hard
Prognostics research has a well known benchmark in NASA's C-MAPSS turbofan degradation data, described by Abhinav Saxena and colleagues in 2008. The data come from a simulation that runs engines from healthy operation to failure under varying conditions, which gives researchers what real fleets rarely provide: many complete run-to-failure histories with known end points.
Industrial sites have the opposite problem. Machines are repaired before they fail, which is the goal, and it means the data needed to train a precise life model are scarce. Every early bearing replacement is a success for the plant and a censored data point for the model. Good systems handle this by working from physics where they can, by learning from fleets of similar machines, and by stating their uncertainty plainly rather than producing a single confident date.
There is also a practical limit. A remaining life estimate assumes the future looks like the recent past. If the pump moves to a heavier duty, or lubrication is restored, or the plant shuts down for a week, the estimate has to change. Prognosis is a running forecast, not a verdict.
The cost of blurring the stages
Confusing anomaly with failure goes wrong in two directions.
Treat every anomaly as an impending failure, and crews are sent to inspect machines that turn out to be fine. After a few weeks they stop trusting the alerts, and the one that matters gets the same skeptical response as the twenty that did not. Treat a real developing fault as just another anomaly, and the warning is wasted. The data showed the problem, but no one acted on it in time.
Both errors come from collapsing four questions into one alert. Systems that keep the stages distinct can say something more useful: here is a change, here is what we think it is, here is how confident we are, and here is how long we think you have. That message is the practical difference between monitoring and understanding, and it is the core idea behind anomaly detection and machine intelligence as AFFERENT approaches it.
Questions to ask of any system
- Does it learn each machine individually, across operating states, or apply one threshold to all?
- When it flags an anomaly, can it say which signal changed and by how much?
- Does it attempt a diagnosis, and does it show the evidence for it?
- Does it give remaining life as a range, and does that range update as new data arrive?
- How does it treat changes caused by maintenance, operating shifts or faulty sensors?
A monitoring program that can answer these questions well is ready to move from noticing change to explaining it. That shift, from anomaly to understanding, is where machine health work starts paying for itself.
Sources
- ISO 13374-1:2003, Condition monitoring and diagnostics of machines: data processing, communication and presentation
- ISO 13381-1:2015, Condition monitoring and diagnostics of machines: prognostics
- Nowlan and Heap, Reliability-Centered Maintenance, U.S. Department of Defense report (1978)
- Saxena et al., Damage Propagation Modeling for Aircraft Engine Run-to-Failure Simulation, NASA (2008)
- DCASE 2020 Challenge, Task 2: Unsupervised Detection of Anomalous Sounds for Machine Condition Monitoring


