
Of all the measurements in industry, temperature is the most familiar. Almost every control system reads it, almost every technician carries something to check it, and almost everyone has an intuition for it: hot is bad. That intuition is right often enough to be useful and wrong often enough to be dangerous.
A temperature reading on its own says surprisingly little about the health of a machine. Whether a bearing at 65 degrees Celsius is fine or failing depends on its load, its speed, the temperature of the room, its history and what similar bearings are doing. This article explains what thermal sensing reveals, the main ways it is done, and why context turns temperature from a number into evidence.
Why heat is evidence
Nearly every way a machine can degrade turns some energy into unwanted heat. Friction in a poorly lubricated bearing produces heat. Electrical resistance in a loose or corroded connection produces heat in proportion to the square of the current. Failing cooling fans, clogged filters and fouled heat exchangers let heat build up where it should be carried away. Insulation that is breaking down heats as it degrades. Overloaded motors run hot.
Heat is therefore a broad indicator. It does not usually say exactly what is wrong, but it says that energy is going somewhere it should not. That is valuable, because thermal changes can be measured without touching moving parts and sometimes without touching the equipment at all.
Three ways to measure
Point sensors, such as thermocouples, resistance temperature detectors and thermistors, measure temperature at a single spot. They are cheap, accurate and easy to install permanently, and they are the basis of most continuous thermal monitoring. Their limitation is coverage: they only know about the spot they touch.
Infrared spot sensors measure the thermal radiation from a small area without contact. They suit moving or energized surfaces, such as a conveyor or a busbar, where contact is impractical. Their readings depend on the emissivity of the surface, which varies with material and finish, so shiny metal can read much cooler than it is.
Thermal imaging builds a picture of surface temperatures across a whole scene. It is the standard tool for electrical inspections because it shows at a glance which component is hotter than its neighbors. Most thermal imaging in industry is still done as periodic surveys by trained thermographers with handheld cameras. Permanently installed thermal cameras exist but are usually reserved for the most critical assets.
The hot spot that matters
The classic thermal finding in electrical systems is a single connection running hotter than its neighbors. Three phases of a circuit carry similar current, so they should run at similar temperatures. When one phase is markedly hotter under the same load, a loose, corroded or undersized termination is the usual cause.
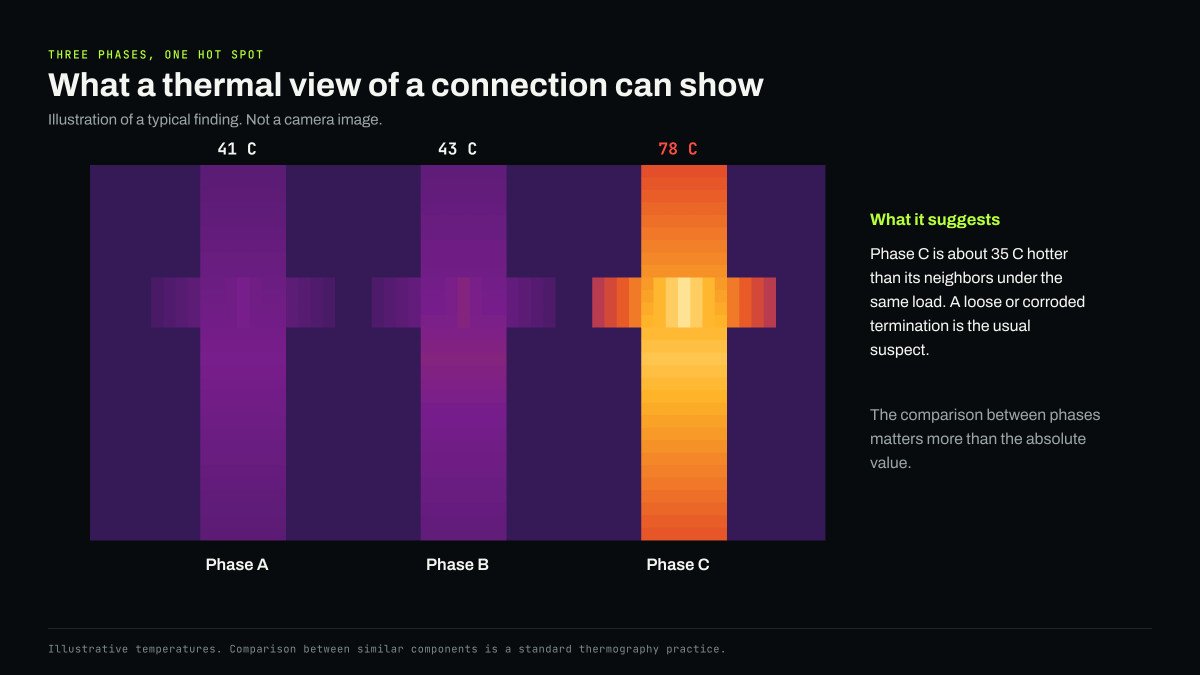
Thermographers rely on exactly this comparison. Industry testing standards classify the severity of electrical hot spots largely by how much hotter a component is than similar components under similar load, or than the ambient air, rather than by absolute temperature alone. The comparison removes much of the effect of load and ambient conditions, because similar components share them.
The importance of these inspections has grown. In its 2023 edition, NFPA 70B became a standard for electrical equipment maintenance rather than a recommended practice, and, as summaries of the change note, it calls for thermographic inspection of electrical equipment at least every 12 months, and more often for equipment in poor condition.
Why temperature alone misleads
Outside the tidy case of three identical phases, raw temperature is a weak signal. Three kinds of context matter most.
Load. A motor or bearing runs hotter when it works harder. A reading that would be alarming at light load can be perfectly normal at full load, and a dangerous trend at light load can look harmless next to readings taken at full load.
Ambient conditions. Equipment in a plant room that swings from cool nights to hot afternoons, or across seasons, will follow the room. A rise of ten degrees may simply be summer.
History. Every machine has its own thermal character, shaped by its design, installation and duty. A reading is most meaningful compared with that machine's own past behavior under similar conditions.
Fixed temperature limits ignore all three. To avoid nuisance alarms on hot days and at full load, they are set high, which means they often trigger only when damage is advanced. Meanwhile, an early departure from normal can sit well below the limit for weeks.

From readings to residuals
The better approach is to predict what the temperature should be and watch the difference. A model that knows a machine's load, speed and ambient temperature can estimate its expected temperature at any moment. The residual, actual minus expected, removes most of the ordinary variation and leaves the part that needs explaining.
A residual that stays near zero means the machine is behaving as it always has, however hot it is in absolute terms. A residual that drifts upward means something has changed, even if the reading is still below every fixed limit. This is the same idea as the learned baseline used for vibration and sound, applied to heat.
The model does not need to be elaborate. For many machines, a simple relationship between load, ambient temperature and steady-state temperature, learned from a few weeks of normal operation, captures most of the behavior. What matters is that the relationship is learned for each machine, in place, rather than assumed from a datasheet.
Thermal sensing alongside other senses
For mechanical faults, temperature is often a late indicator. A bearing typically shows changes in vibration and ultrasound well before it heats noticeably, and by the time it is hot to the touch, little life may remain. For electrical connections, the reverse is true: heat is often the earliest and clearest sign.
That asymmetry is an argument for combining senses. A rise in vibration at a bearing frequency followed by a rise in temperature residual tells a consistent story of mechanical wear. Heat with no change in vibration points toward electrical, cooling or lubrication causes. And warming that matches a hot afternoon and nothing else is probably weather. Environmental sensing, such as ambient temperature and humidity at the machine, belongs in the same picture, because it explains so much of why thermal readings move.
Thermal data is also cheap to move and store. A temperature reading every minute is a tiny stream compared with vibration or audio, so thermal trends can be kept for years and compared across seasons. That long memory is useful: a residual that creeps upward a little more each summer can reveal a cooling problem that no single day would show.
Emissivity, worked
Infrared measurements carry a trap that catches many first-time users. An infrared camera or sensor does not measure temperature directly. It measures emitted radiation and converts it to temperature using an assumed emissivity, a number between 0 and 1 that describes how efficiently a surface radiates.
Painted metal, rubber and most nonmetallic surfaces have emissivities around 0.9 or higher, close to the default setting on many instruments. Bare, shiny metals are very different. Polished aluminum or new copper bus bar can be 0.1 or lower. Such a surface emits little of its own radiation and reflects a great deal from its surroundings, so a camera set for 0.95 will read it far colder than it really is, and may show reflections of nearby warm objects as if they were hot spots.
A worked example: a shiny copper connection at 80 degrees Celsius, in a room at 25 degrees, measured with an emissivity setting of 0.95 when the true value is around 0.1, can read only about 7 degrees warmer than the room. The fault is real and the reading hides it. Common remedies include applying high emissivity tape or paint to measurement points, viewing surfaces at angles that limit reflections, and comparing similar components under similar load rather than relying on absolute readings. Permanent contact sensors avoid the problem entirely for the points they cover, which is one reason they complement thermal imaging rather than replace it.
Practical lessons
A few principles hold across most thermal monitoring programs.
- Compare like with like. Similar components under similar load are the most reliable reference.
- Record the context. Load and ambient temperature should be captured with every reading, or the reading is hard to interpret later.
- Trend rather than threshold. A slow rise in residual temperature is often more informative than any single value.
- Mind the surface. For non-contact measurement, emissivity and reflections can distort readings, especially on bare metal.
- Use heat as one witness among several. Corroboration from vibration, sound or electrical signals turns a thermal anomaly into a diagnosis.
Temperature will always be part of how we judge machines. The step forward is treating it as evidence to be interpreted in context rather than a number to compare with a limit. That is the role of thermal and environmental sensing in a multimodal system, and it builds on the same logic we described in our article on acoustic monitoring: each sense sees part of the picture, and the combination sees much more.


